功能特点
室内天气监测,包括二氧化碳检测
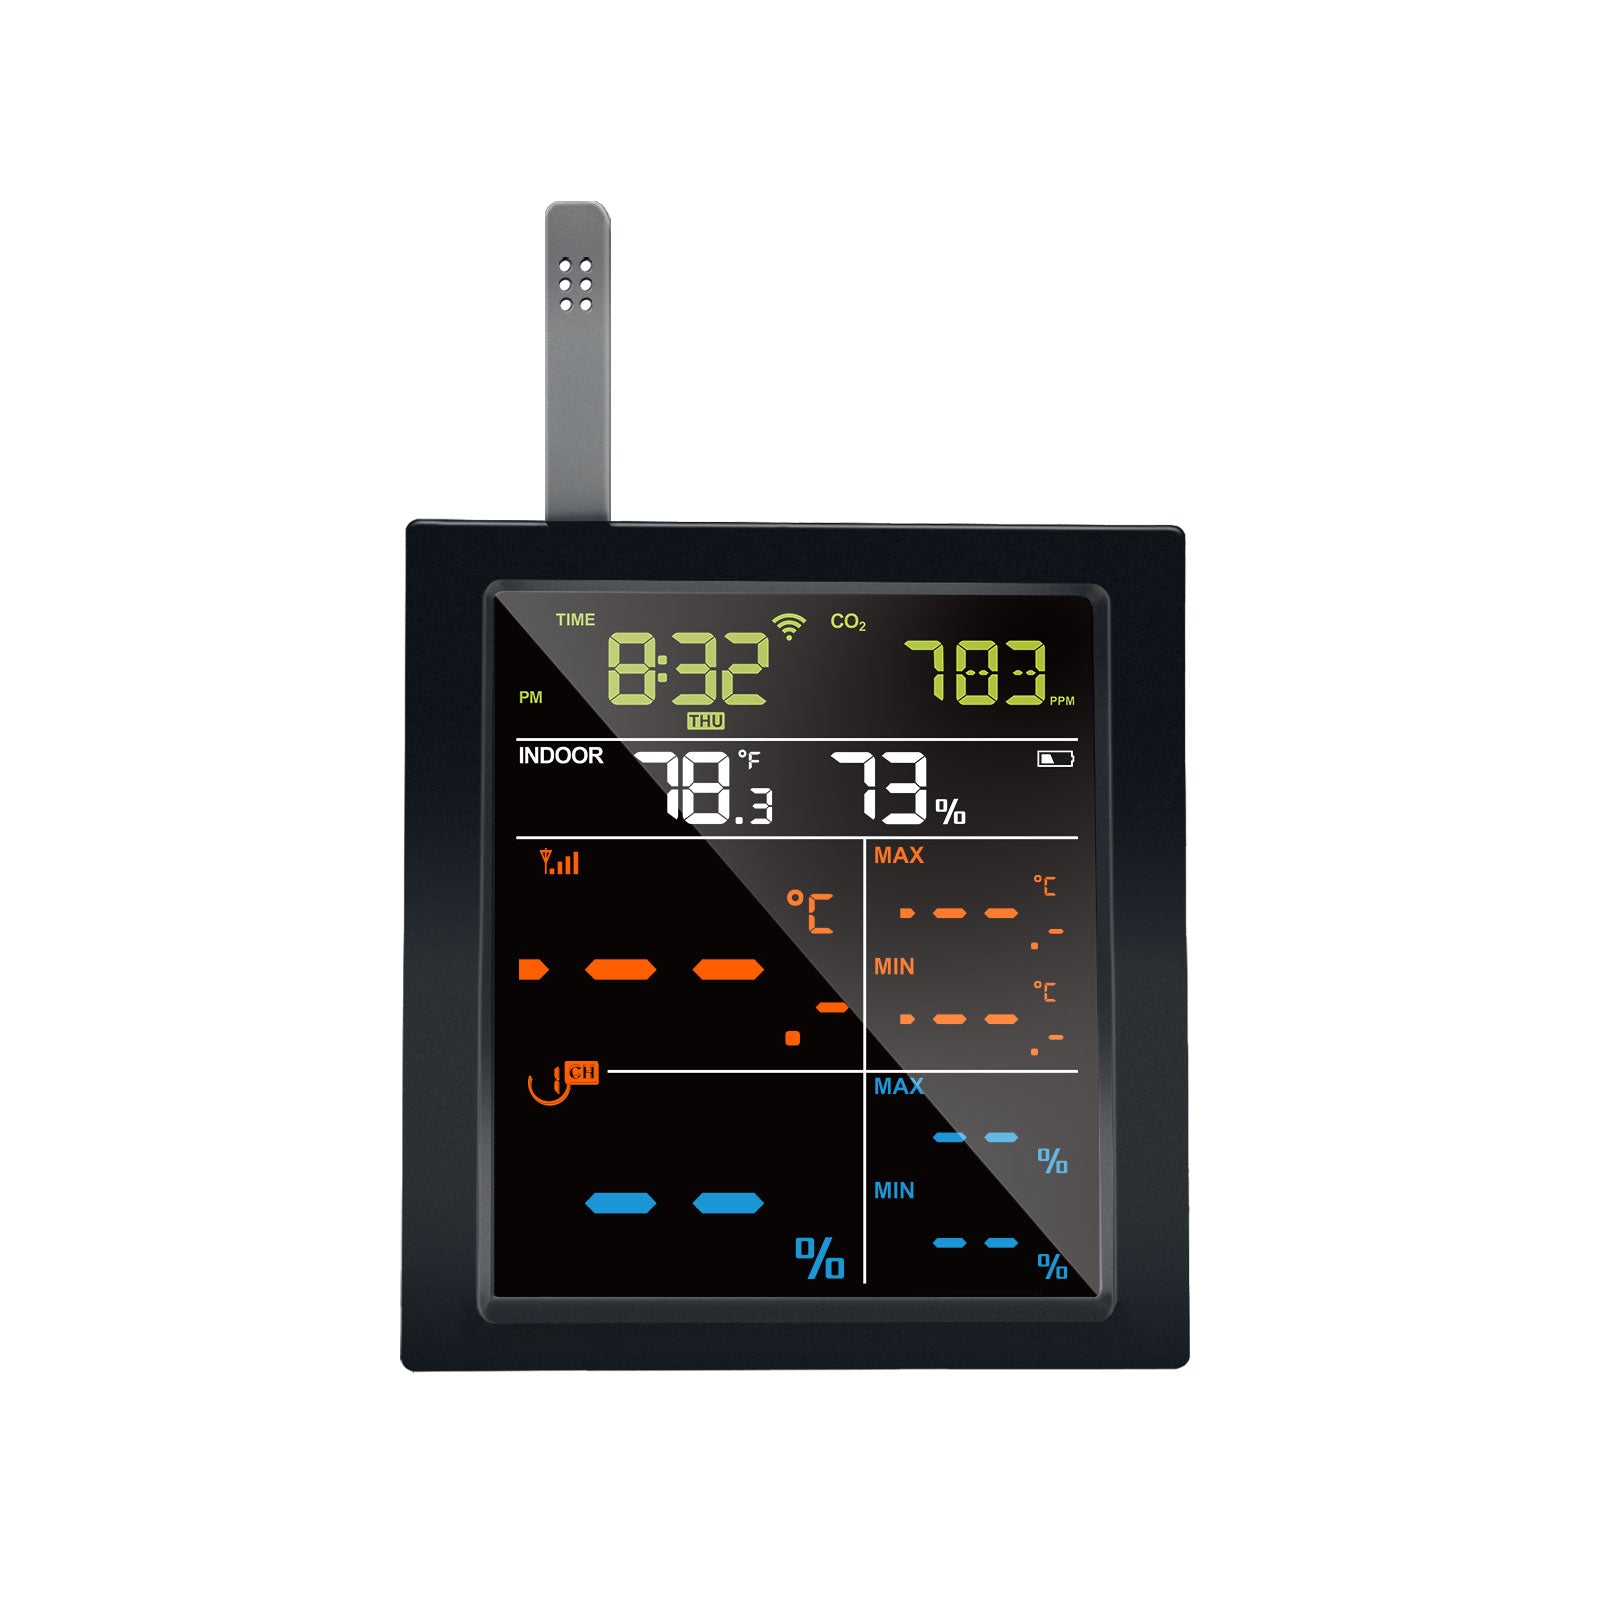
4.9英寸LCD显示屏和内置Wi-Fi网关
一个专为Ecowitt生态系统传感器设计的展示中心
测量:二氧化碳;温度和湿度;气压;
显示内容:
时间&星期;日期或二氧化碳PPM水平,备用电池状态;Wi-Fi和RF信号状态;
室内温度、湿度和气压。
多通道温湿度传感器,带有最低和最高记录。
云服务器内容:
数据和图表记录:相对和绝对气压;室内温度和湿度;多通道温湿度;
服务
网站页面:ecowitt.net;192.168.4.1;
APP:Ecowitt;
天气服务器支持:ecowitt官方云服务器;
Wunderground; Weathercloud; 天气观测网站; 自定义(Homeassistant;);
兼容的附加传感器和物联网设备(单独出售)
1(仅上传)- WS90 传感器阵列
1(仅上传)- WS85 传感器阵列
1(仅上传)- WS80 传感器阵列
1(仅上传)- WS69/WN67 传感器阵列
1(仅上传)- WS68 传感器阵列
1(仅上传)- WN20 迷你雨量计
1(仅上传)- WH40/WH40H 雨量计
1(仅上传)- WH57 雷电探测器
1(仅上传)- WH45/WH46/WH46D 空气质量传感器
1(仅上传)- WN38 黑球温度计
1 - WN32/WN32EP 室外温湿度传感器
1 - WN32P 室内温湿度和气压传感器
4(仅上传)- WH55 漏水探测器
4(仅上传)- LDS01 激光测距传感器
4(仅上传)- WH41 和 WH43 空气质量传感器(PM2.5)的任意组合
8 - WN35 叶片湿度传感器
8 - WN34L、WN34S 和 WN34D 温度传感器的任意组合
8 - WN31/WN31EP 温湿度传感器、WN30 温度传感器和 WN36 泳池温度计的任意组合。
16(支持多达8个通道的湿度数据显示)- WH51、WH51L、WH52 土壤传感器的任意组合
16(仅上传)- WFC01 水定时器、AC1100 智能插座和 WFC02 球阀定时器的任意组合
注意: 请注意,当网关或控制台连接到测量相同参数的多个传感器时,系统将优先显示来自具有最高优先级的传感器的数据。
| 数据接收优先级 | 型号 |
| 室外温湿度 | WN32/WN32EP > WS90 > WS80 > WS69/WN67 |
| 气压、室内温湿度 | WN32P > 网关/控制台内置传感器 |
| 风速 | WS85 > WS90 > WS80 > WS68 > WS69/WN67 |
| 传统降雨 | WH40/WH40H > WN20 > WS69/WN67 |
| 压电降雨 | WS85 > WS90 |
| 太阳光照和紫外线指数 (UVI) | WS90 > WS80 > WS68 > WS69/WN67 |
规格(显示)
| 测量项目 | 范围 | 准确度 | 分辨率 | 工作条件 |
| 气压 | 300至1100百帕(8.85至32.5英寸汞柱) |
绝对压力:±1.5hpa; 相对压力:±2hpa |
0.1hPa (0.01 inHg) | 推荐 |
| 温度(室内) | 0°C 至 50°C(32°F 至 122°F) | ± 0.2°C(± 0.4°F) | 0.1°C (0.1°F) | 推荐 |
| -40°C 至 60°C(-40°F 至 140°F) | ± 0.6°C(± 1.0°F) | 0.1°C (0.1°F) | LCD显示或CO2可能失效 | |
| 湿度(室内) | 30% 至 70% | ± 1.8% | 1% |
推荐 |
| 1% 至 99% | ± 3% | 正常 | ||
| CO2 | 0 至 40000 ppm | ± (50 ppm + 读数的5%) | 1ppm | 推荐 |
电源供应:5V ⎓ 1.0A 5.0W
备用电源:2节AA电池(支持至少24小时工作)
Wi-Fi传输
开阔地传输距离:50米(165英尺),取决于路由器和环境
射频频率:2.4 GHz
无线局域网和以太网:802.11 b/g/n(802.11n,最高150 Mbps)
互联网更新:自定义1-5分钟(建议1分钟)
部件清单
1个 WN1821 显示屏(控制台)
1根 USB 转 2.5*0.7mm 直流5V电源线用于显示屏
包装信息
重量:350克
电池:无
注意: 这不是一个独立的产品,需要与其他传感器配合使用。
 | |
|---|---|
| Built-in sensor measurement | |
Pressure |
|
Indoor Thermo-Hygrometer (Temp & Humidity) |
|
CO₂ |
|
| Display Content | |
Relative Pressure |
|
Indoor Temperature |
|
Indoor Humidity |
|
| Console Features | |
Built-in a Wi-Fi Gateway |
|
Manage sensor on app |
|
| Connection & Data | |
Wi-Fi (2.4G only) |
|
RF Wireless protocol |
|
| Addable | |
Ecowitt IoT Device |
|
Ecowitt Sensor |
|
兼容性说明
适用于所有ecowitt网络控制台
请在结账前参考表格选择正确的传感器和控制台。
注意:
1) "1/4/8/16" = 每个控制台支持的最大传感器数量(不包括配件)。
2) 仅上传 = 传感器读数仅显示在ecowitt应用程序和云端(www.ecowitt.net)。
3) 固件(例如V1.9.6 / V2.0.2)= 网关/控制台必须运行此版本或更新版本。